Data Visualization
Learn about CHITRA's visualization features and capabilities
Visualising the Data
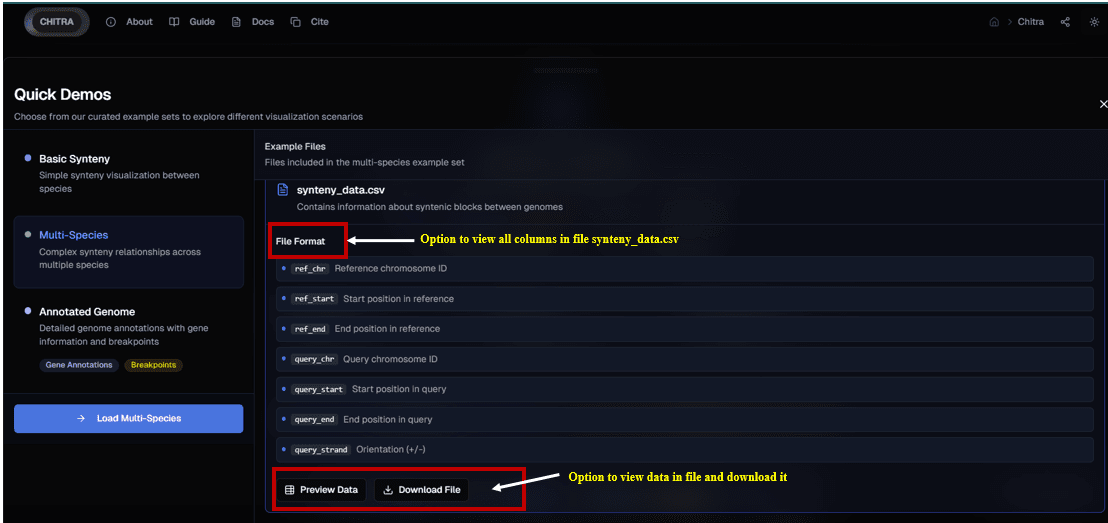
The tool provides an intuitive and user-friendly platform for visualizing genomic data, enabling effective exploration of DNA segments, such as chromosomes, contigs, or scaffolds, across complete genomes. Through interactive features, users can easily identify and analyze synteny blocks (common genomic regions) between genome.
Synteny Visualization
-
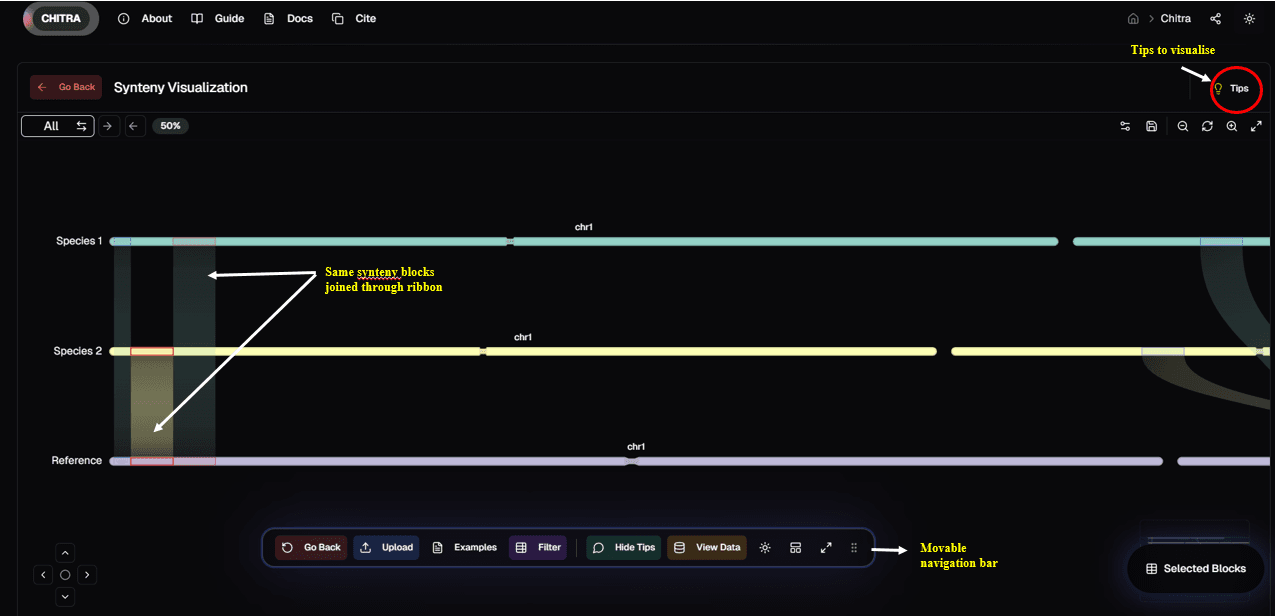
Basic Synteny Comparison: The tool displays synteny relationships between two genomes and a reference genome. Common synteny blocks between DNA segments of the genome are linked by ribbons, providing a visually engaging and clear representation of genomic conservation.
-
By hovering over a ribbon, users can identify:
-
The synteny block shared between the two genomes
-
The alignment of the synteny block with the reference genome
-
Block Size Definitions: The category assigned to a synteny block is determined by its absolute size in megabases (Mb). The categories are defined as follows:
- Large: Greater than 10 Mb
- Medium: Greater than 5 Mb and up to 10 Mb
- Small: Greater than 1 Mb and up to 5 Mb
- Micro: 1 Mb or less
-
Relative Size Representation: A progress bar below the category information provides a visual representation of the hovered synteny block's size relative to the largest synteny block in the current dataset. Help text below the bar (e.g., "Size relative to a XXMb synteny block") clarifies the exact benchmark size it is being compared against.
-
Ribbon Coloring & Meaning
The color scheme is designed to be highly functional, encoding both structural origin and orientation data:
- Strand Orientation: The synteny blocks themselves intrinsically encode orientation, automatically appearing in Blue (Forward strand) or Red (Reverse strand).
- Genome Origin (Default): By default, the synteny ribbons connecting blocks are colored based on the query genome they originate from. This is highly informative in multi-genome alignments as it instantly clarifies which query genome is connecting to the reference. These default genome colors are fully customizable.
- User-Defined Rearrangements: For known structural variations, users can select specific synteny ribbons and assign them custom colors via the Mutation Menu (e.g., coloring distinct inversion or translocation events), thereby overriding the default genome colors.
Accessibility & Customization
- Colorblind Palettes: An accessibility toggle (♿) sits at the bottom right corner of the visualization. Users can instantly switch the application's entire visualization matrix—including synteny ribbons, markers, and genome colors—to colorblind-safe palettes (e.g., Deuteranopia, Protanopia, Tritanopia palettes based on Wong, 2011).
- Chromosome Reordering: In the top controls, a Floating 'Reorder' Panel allows users to drag-and-drop chromosomes to set a custom linear layout (e.g., placing chr5 next to chr2) and the visualization will instantly snap and redraw all ribbons to match.
Data Table Integration
- Bidirectional Linking: The Raw Data Table integrated at the bottom of the screen is fully linked to the visual matrix. Selecting specific synteny rows directly within the Raw Data Table immediately highlights the corresponding visual ribbons on the chromosome tracks to simplify searching specific dense regions.
Interactive Chord Maps
Users can click on a synteny block to access a detailed chord map that provides comprehensive information, including:
-
The reference chromosome number and its corresponding chromosome in the query genomes
-
The size and location of the synteny block in both genomes
-
The orientation of the synteny block (forward or reverse) in the genomes
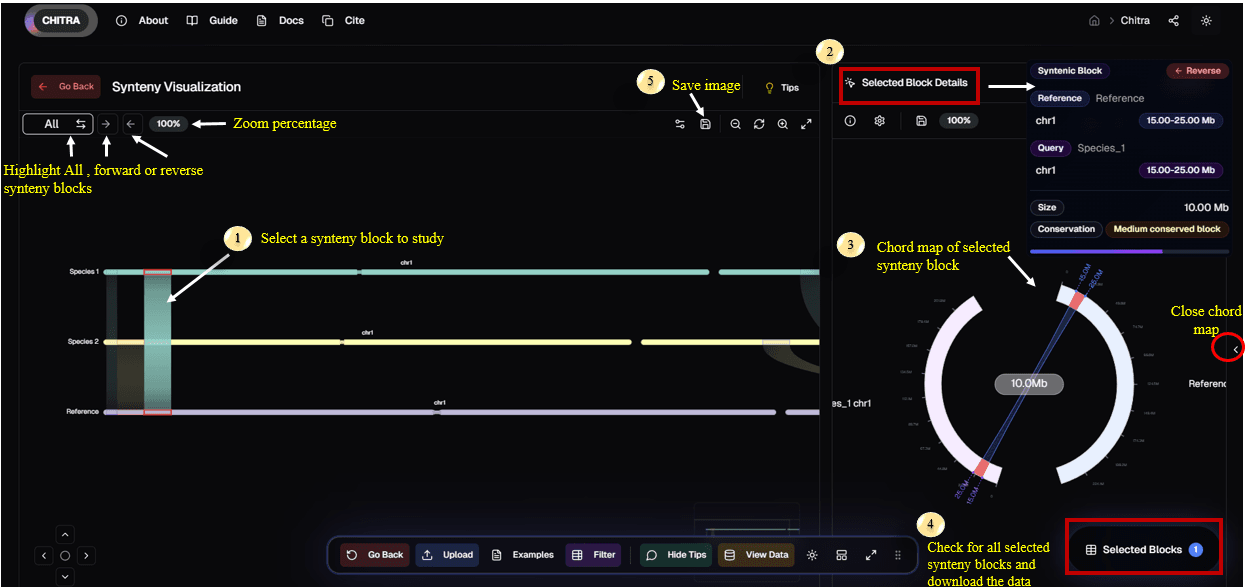
This interactive chord map allows for a deeper understanding of genomic relationships and structural variations between genomes.
Exporting and Downloading Options
- Data Export: Selected synteny blocks are listed in a "Selected Box", where users can export this information in CSV format for further analysis
- Image Download: The tool allows users to download synteny plots showing synteny blocks in various formats, including SVG, PNG, and JPG, providing high-quality visuals for presentations, publications, or additional analysis