Interactive Features
Explore CHITRA's interactive features and tools
The tool is equipped with several interactive features to enhance user experience and make data visualization seamless:
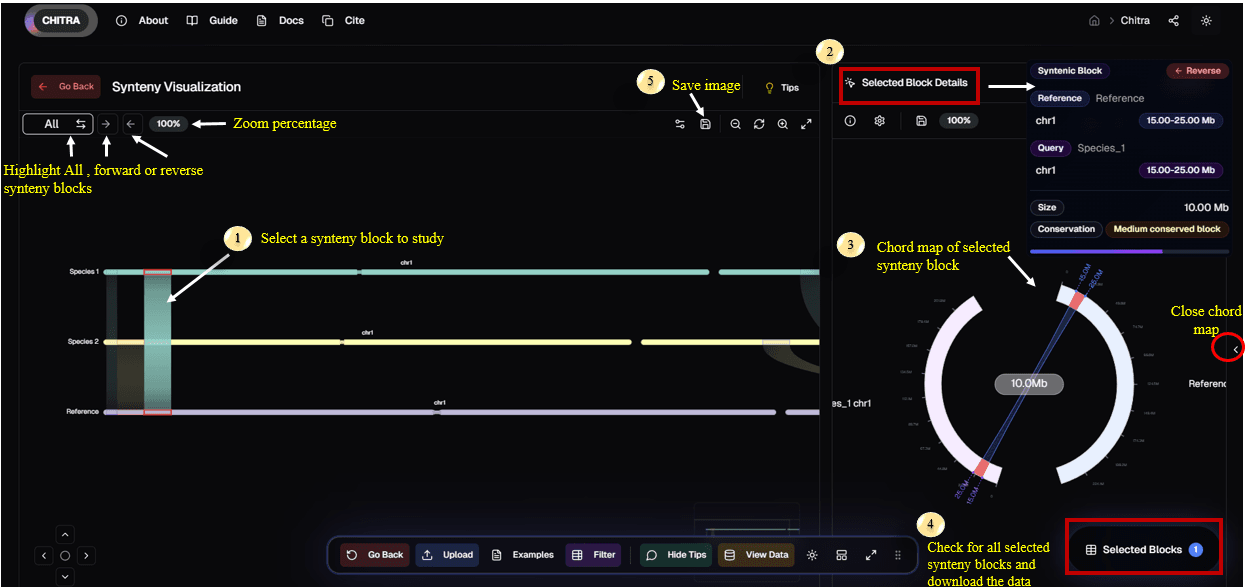
1. Select Synteny Block
- Click on any synteny ribbon in the linear view to select it for detailed analysis
- The selected block is highlighted across both the reference and query tracks
2. Selected Block Details
- View comprehensive information about the selected block in the side panel
- Includes details such as Reference/Query coordinates, size, and conservation status
3. Chord Map Visualization
- A circular chord map automatically generates for the selected synteny block
- Visualize the relationship and orientation between the reference and query chromosomes
4. Selected Blocks & Data
- Access the "Selected Blocks" menu from the bottom navigation dock
- View a list of all currently selected blocks and download their specific data
5. Save Image
- Use the Save Image icon in the top toolbar to export the current visualization
- Capture high-quality images of your analysis for publications or reports
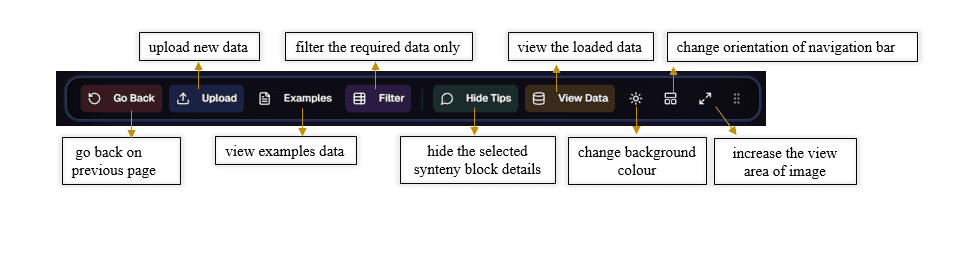
6. Navigation Bar
The movable navigation bar includes:
- Go Back Button: Return to the previous step
- Upload Option: Upload data files directly
- Example Data: Load example datasets
- Filter Button: Filter required synteny blocks
- Hide Button: Toggle synteny block details
- View Button: Access uploaded data
- Background Color Option: Switch between black and white modes
- Orientation Option: Adjust navigation bar position
Annotations and Chromosomal Breakpoint Visualization
To visualize chromosomal breakpoints in the reference genome, users can explore the example dataset labeled "Annotated Genome". This dataset includes additional information, such as annotations and chromosomal breakpoints, alongside synteny block data.
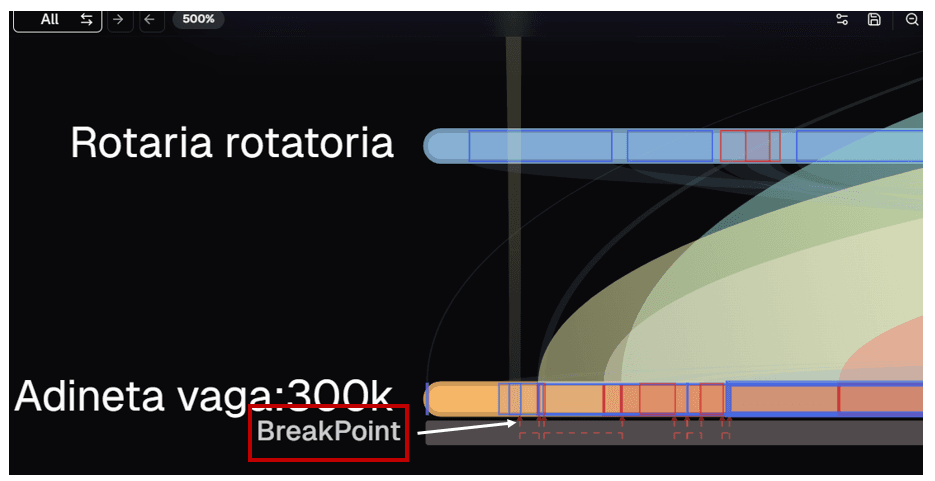
Key visualization features:
- Chromosomal breakpoints in the reference genome are shown as red arrows in the synteny plot
- Breakpoints are highlighted in the chord map as red lines on the reference genome chord
- These features enable precise identification of structural changes and their genomic locations
Color tagging Mutation types
CHITRA provides a color-coding to distinguish between different types of mutations and synteny relationships for the selected ribbons:
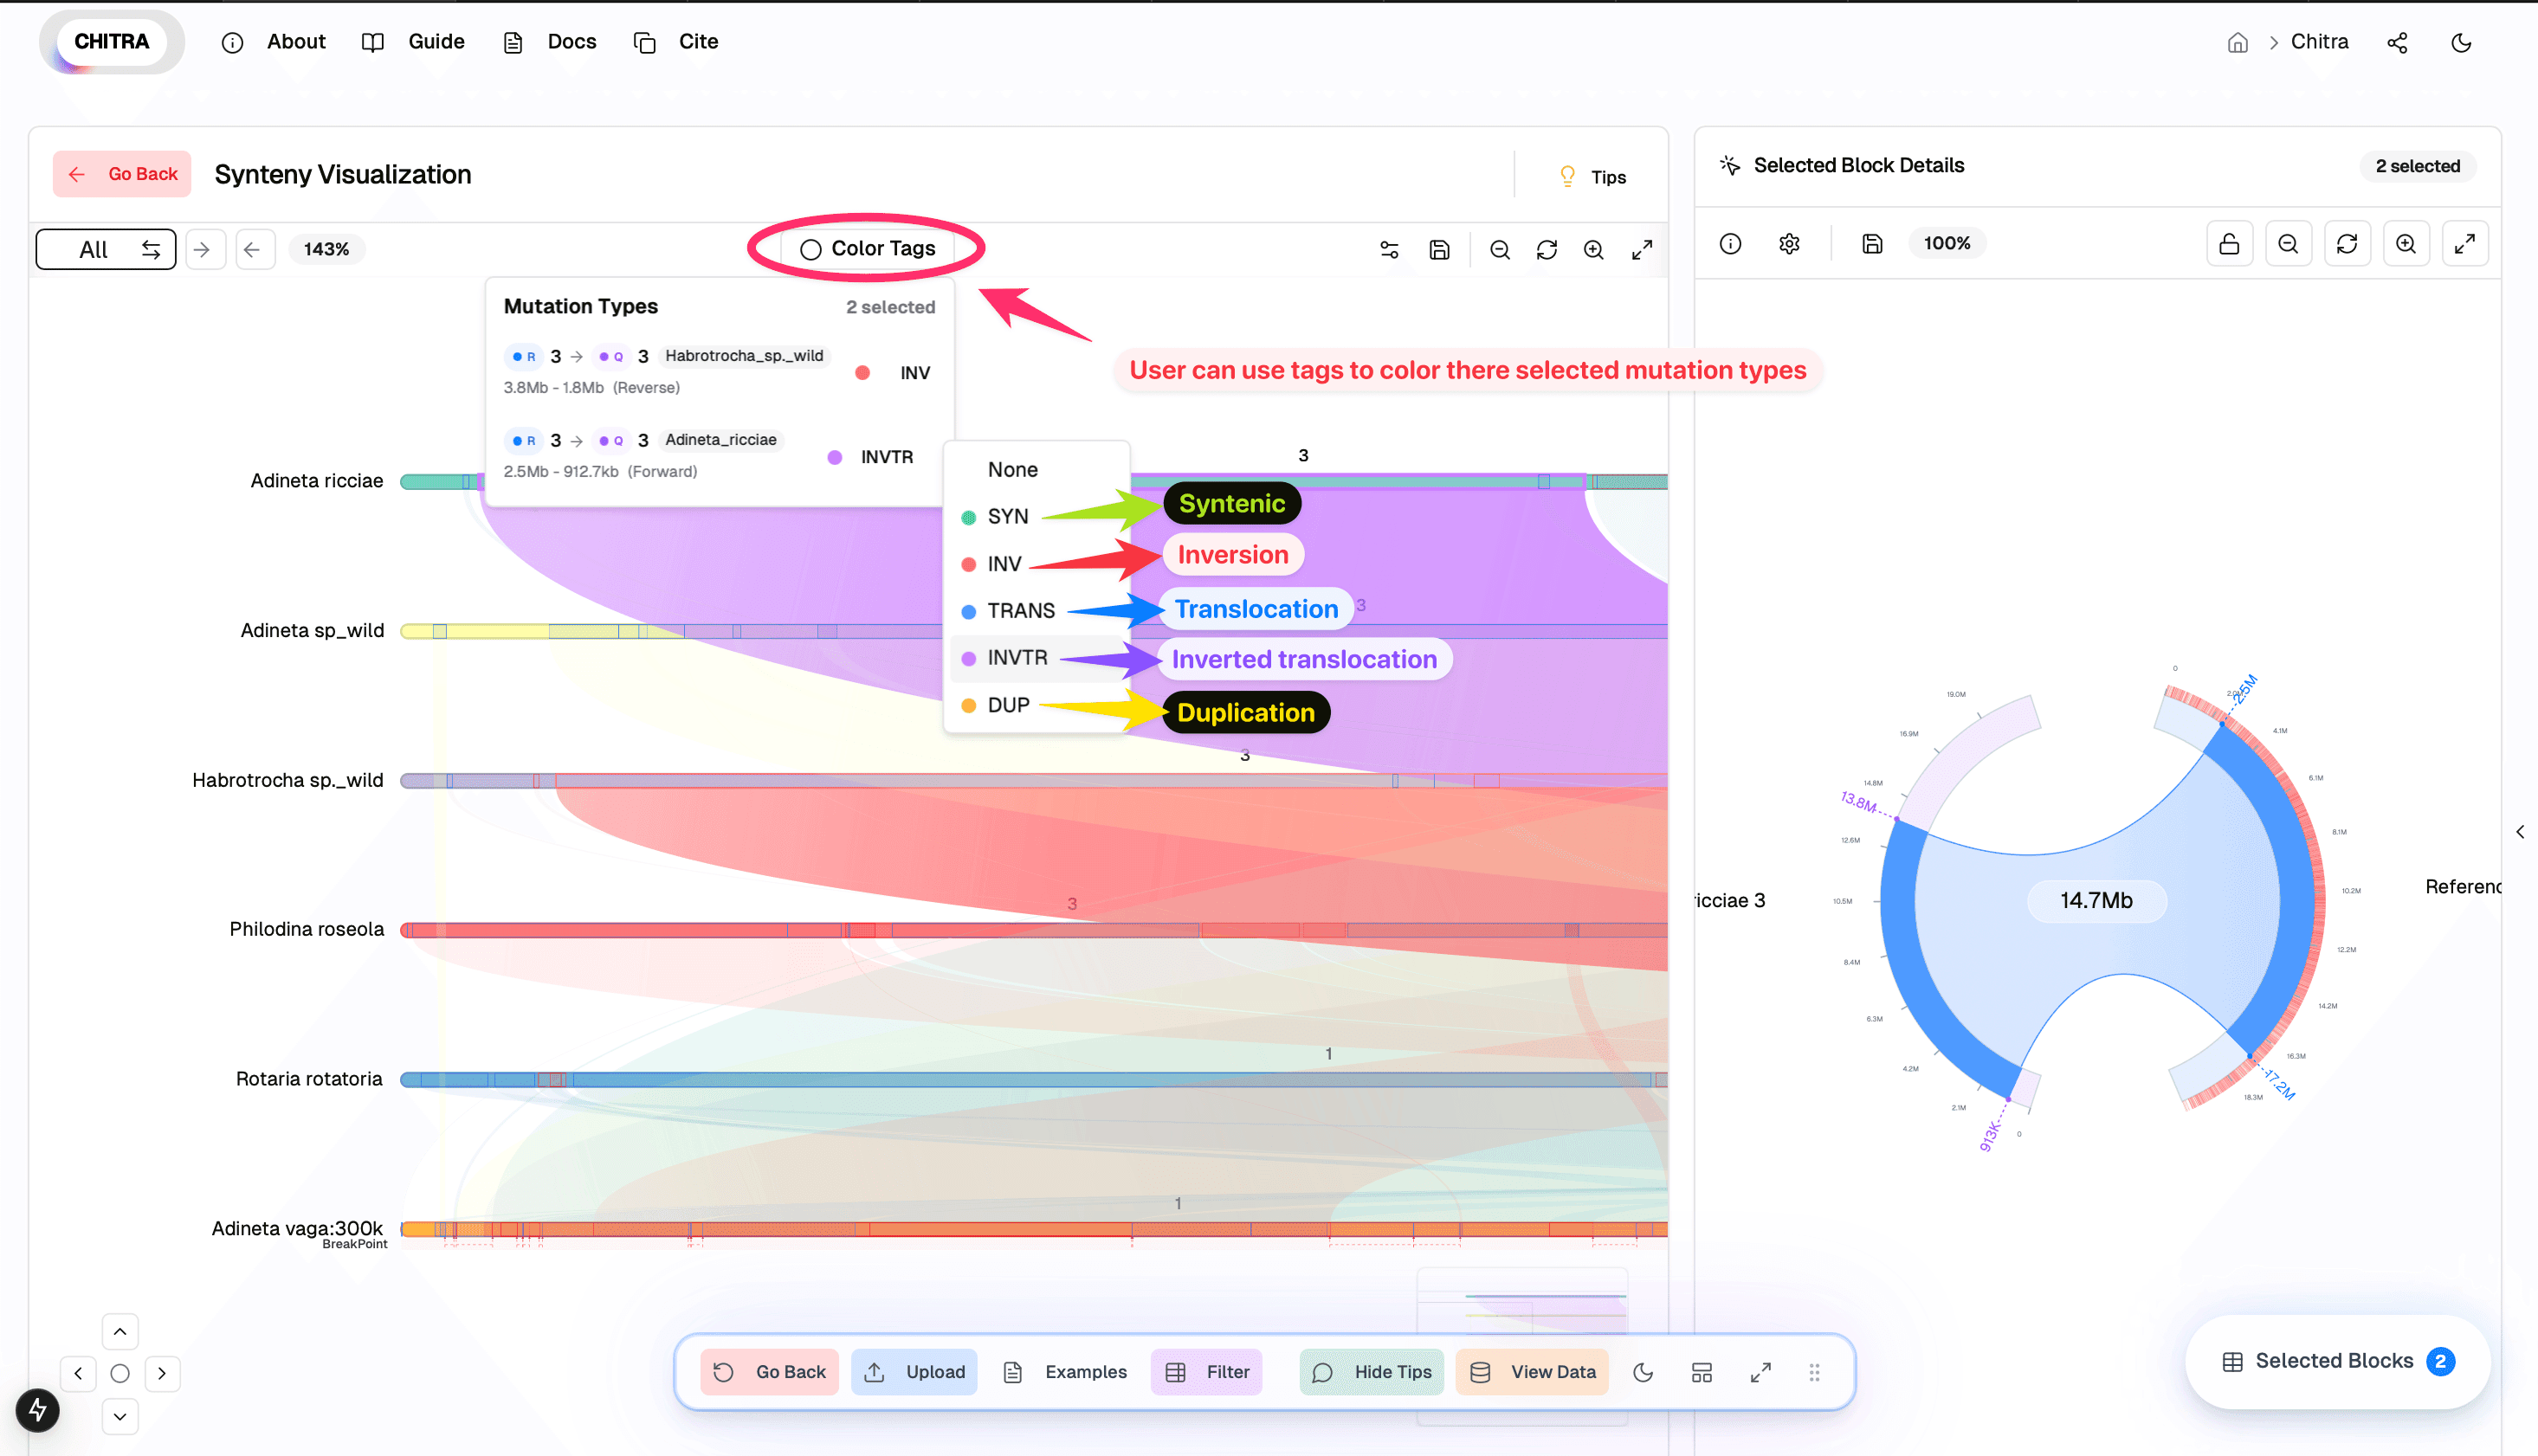
1. Color Tags Feature
- Located in the top navigation bar
- Allows users to visually categorize and highlight different mutation types
2. Available Mutation Types
- SYN (Green): Syntenic regions
- INV (Red): Inversions
- TRANS (Blue): Translocations
- INVTR (Purple): Inverted translocations
- DUP (Yellow): Duplications
3. How to Use
- Click on the "Color Tags" button in the top toolbar
- Select the mutation types you want to highlight
- The corresponding regions in the synteny plot will be colored according to their mutation type
- Multiple mutation types can be selected simultaneously for comparative analysis
4. Visual Integration
- Colors are consistently applied across both the synteny plot and chord map
- Helps in quick identification and analysis of different genomic rearrangements
- Enhances the understanding of complex genomic relationships